Comparing vectors, grids, and TINs
open topo_data project, select the” Data Types” tab.
-
- From DEM to a vector (contour) image (Example here from Lexington).

Note how there’s a good bit more information in the 20 ft contours than the DEM. You can see the river and the steep slopes by the Maury River
-
- From DEM to TIN (must turn on the 3D analyst extension or use the toolbox)

- each “facet” is shaded according to aspect (illuminated from NE, I think).
- The river doesn’t come out too well because it is narrow. There is a threshold value that you can set

- You can see how the ridge lines are nicely framed by the TIN however.
-
- TINs can also be contoured
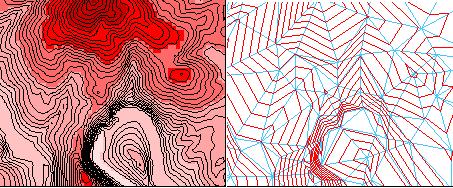
The contours on the left are only 40 ft intervals, those on the left are from the above example at 20 ft.
- We may try some 3d views in class.