Electromagnetic radiation is changed by the atmosphere, but reflectance (the bulk of satellite imaging for mapping) depends greatly on the spectral signature of the material reflecting the incoming radiation.
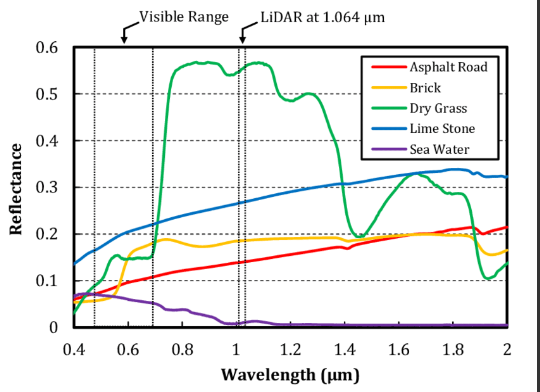
https://www.researchgate.net/figure/Spectral-reflectance-of-different-materials-across-visible-to-infrared-wavelengths_fig3_268215215

Resources for spectral signatures
- Compare satellite bands and material spectra. Launch viewer here
https://landsat.usgs.gov/spectral-characteristics-viewer - Here’s a site with a spectral comparison of some satellites and some earth materials
http://www.physics.nus.edu.sg/~crisp/cd2001/tutorial/optical.htm -
spectral plots of minerals ( tons! ) and many landcovers (at the bottom of the list)
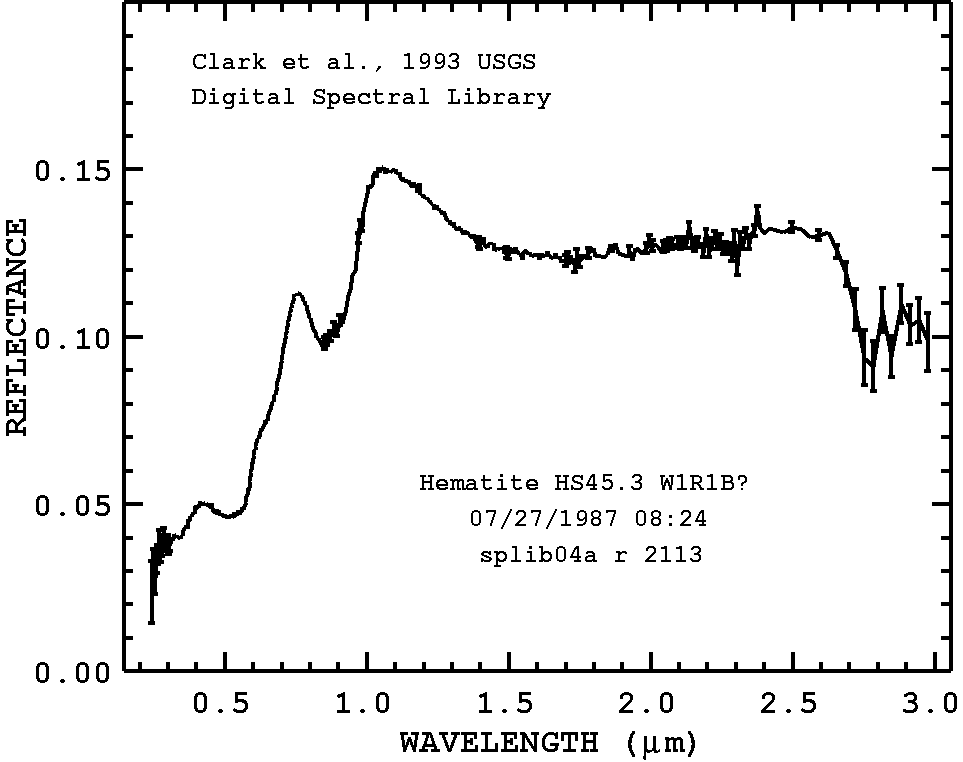
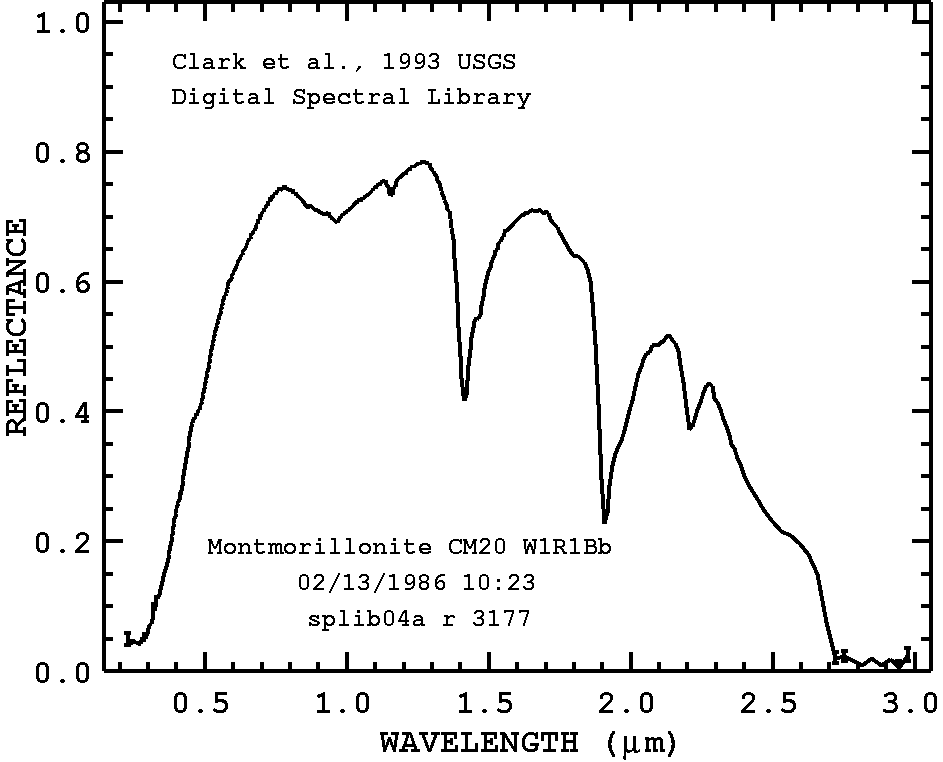
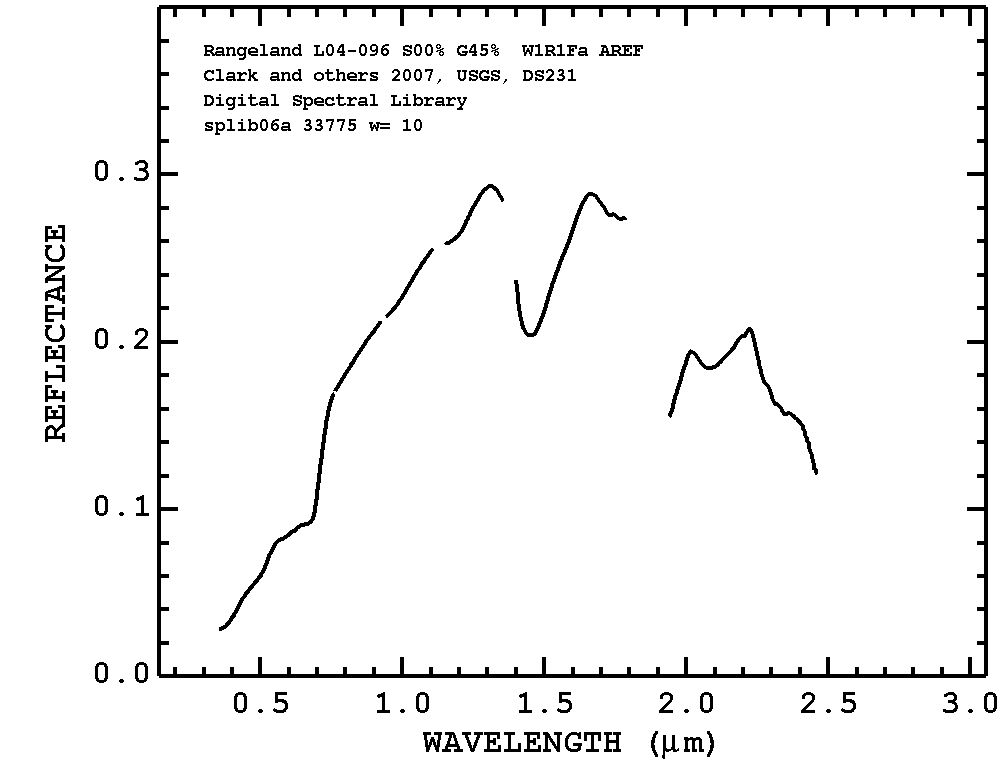
http://speclab.cr.usgs.gov/spectral.lib06/ds231/datatable.html
like these two likely soils constituents and land covershematite
Montmorillonite
Rangeland (here)
Wetland


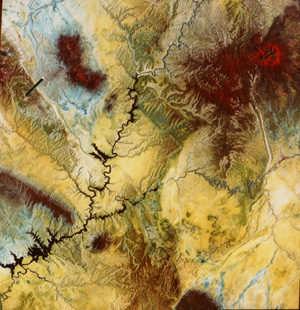
Example Use of Specctra: Using TM to map Geology in Utah (http://rst.gsfc.nasa.gov/Sect13/Sect13_4.html) well… that NASA link is broken…so these guys mirrored it (? http://geoinfo.amu.edu.pl/wpk/rst/rst/Sect2/Sect2_1.html)

Let’s poke around in Lexington. Go here, choose the Landsat Explorer app
http://www.esri.com/landing-pages/software/landsat/unlock-earths-secrets
- grass
- pavement or buildings
- water (silty vs clear?)
- pine
- deciduous (summer vs winter?)
- pastures (summer vs winter?)
- bare soil
Then change the time of year! Leaf on? Leaf off? How about a desert? What do we see there?
Where else are you curious about “multispectral” (multiband) reflectance? Let’s go there!