GPS (multiple overlapping orbits, 29 satellites and growing)
sensor mechanisms
photographic
earliest satellite photographic images from Corona spy satellite captured on mylar negatives and dropped from the satellite.
snagged in the air by planes near Hawaii.
now in the public domain (resolution down to 6 ft) at USGS Earth Explorer.
missions are named KH1 through KH9. The images extend possible landscape change analysis back at least a decade. Operated from 1959 to 1972, when a Soviet sub was found to be submerged near the recovery site.
active digital sensors – emit radiation and record reflection.
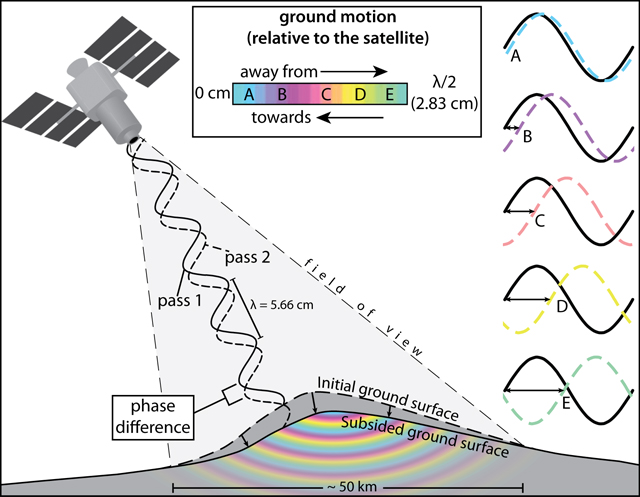
most common one is radar (RAdio Detection And Ranging) (JPL description)
and
the new kid on the block is LIDAR (Light Detection and Ranging)
“panchromatic” (SPOT and TM7 and Landsat8 OLI, band 8) versus narrow bands in the electromagnetic spectrum.
multiple, narrower bands (up to hyperspectral,tens to hundreds of bands)
TM Band 6 is lower resolution due to low radiance and desire to sense at night (was 120 m on landsat 4&5, now with ETM+ is 60 m)
errors due to
sensor calibration differences (spectral error)
scan line shift (geometric error)
data types
scale – resolution and scale are inversely related; can’t have both
large pixel size, broad coverage (1-10 km grids, weather, global land characterization, ocean temp/chlorophyll mapping)
small pixel size, detailed coverage (TM for landuse, spy sats, construction/planning, 30 to <1 m)
image type
panchromatic
multispectral (numerous “bands” of the EM Spectrum Sampled)
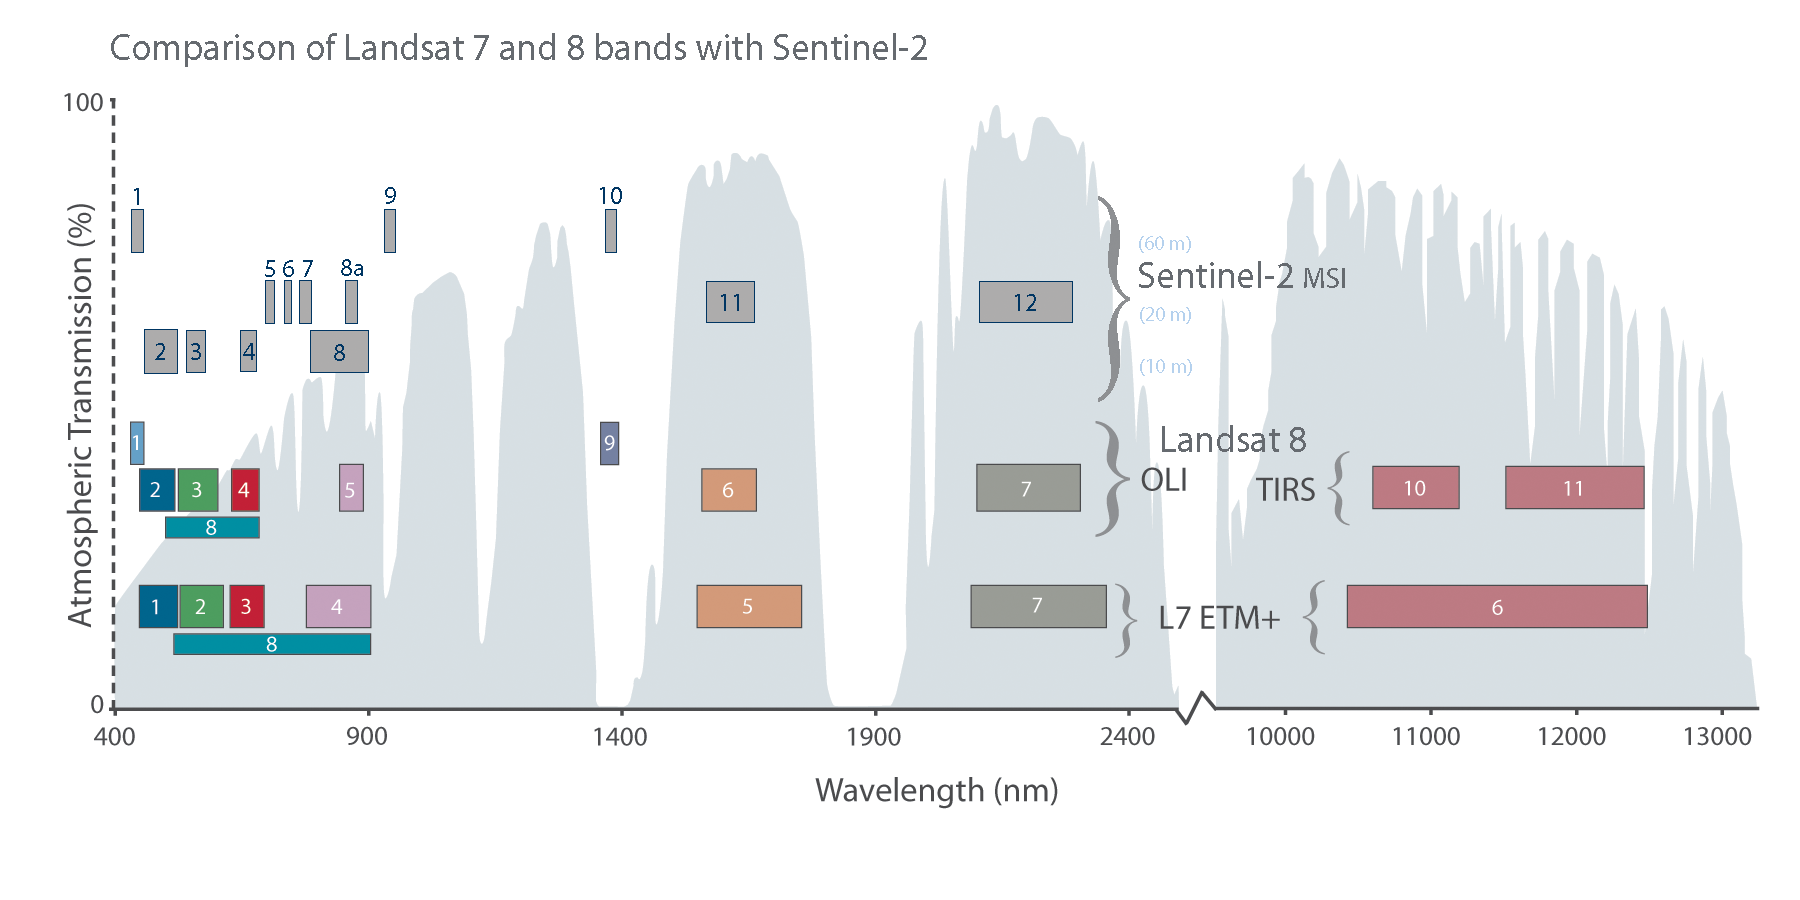
TM 7 & 8 vs ESA Sentinel 2
(https://landsat.gsfc.nasa.gov/wp-content/uploads/2015/06/Landsat.v.Sentinel-2.png)
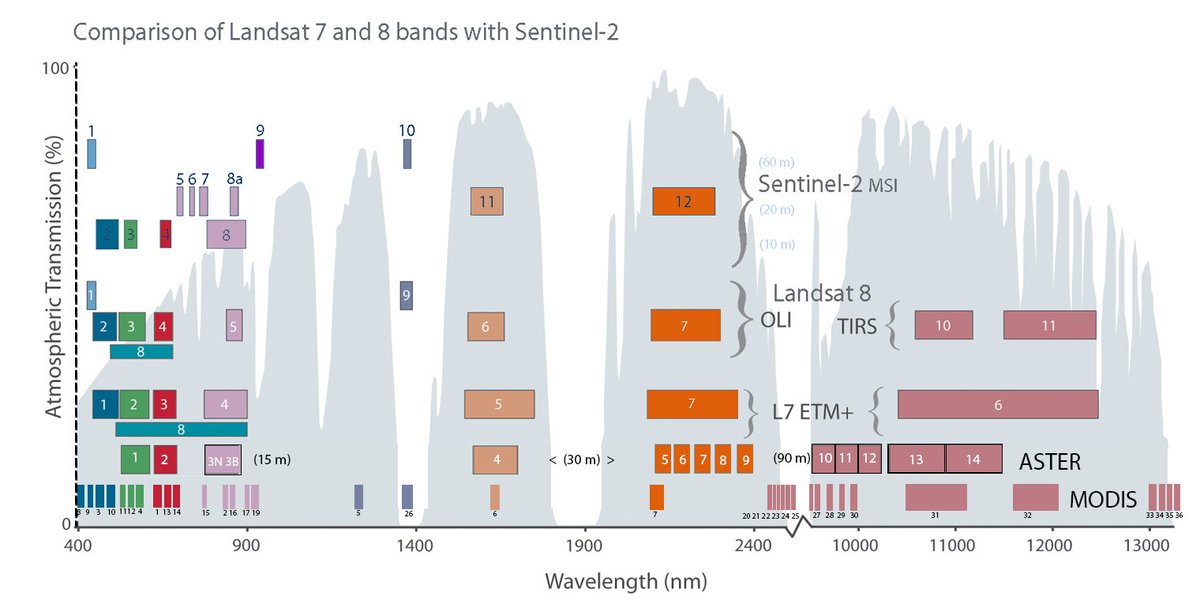
plus ASTER and MODIS
https://pbs.twimg.com/media/C6VUvg1WMAAVTPG.jpg
hyperspectral (gazillions of bands, still on planes, not yet in space)