Digital Topography
What’s in a name—-DEMs, TINs, DLGs, DTMs, Point Clouds
- DTM – digital terrain model (general name for digital topography, involves representation/generalization)
- DEM – digital elevation model (gridded representation of point topography)
- DLG – digital line graph (of contours, but same format for rivers rivers, transport)
- TIN – triangular irregular network (triangular “facets,” each of which has a constant slope and aspect). Also known as “nets,”
- Point cloud – returns from a terrestrial or airborne LIDAR that give ground and vegetation elevation (we’ll cover these later)
- Some advantages of TINS include:
- Fewer points are needed to represent the topography—less computer disk space needed.
- Points can be concentrated in important areas where the topography is variable and a low density of points can be used in areas where slopes are constant.
- Points of known elevation such as surveyed benchmarks can easily be incorporated
- Areas of constant elevation such as lakes can easily be incorporated
- Lines of slope inflection such as ridge lines and steep canyons streams can be incorporated as breaklines in TINS to force the TIN to reflect these breaks in topography.
http://www.ian-ko.com/resources/triangulated_irregular_network.htm
Open the topo_data project demotopo folder.
-
- The first tab “lat long vs UTM” shows GCS vs projected data. We’ll talk about projection. These are 1 arc second data points (raster) in Lat/Long (geographic coordinate system or “GCS”) and same data projected to a 30 m grid (raster) in UTM.
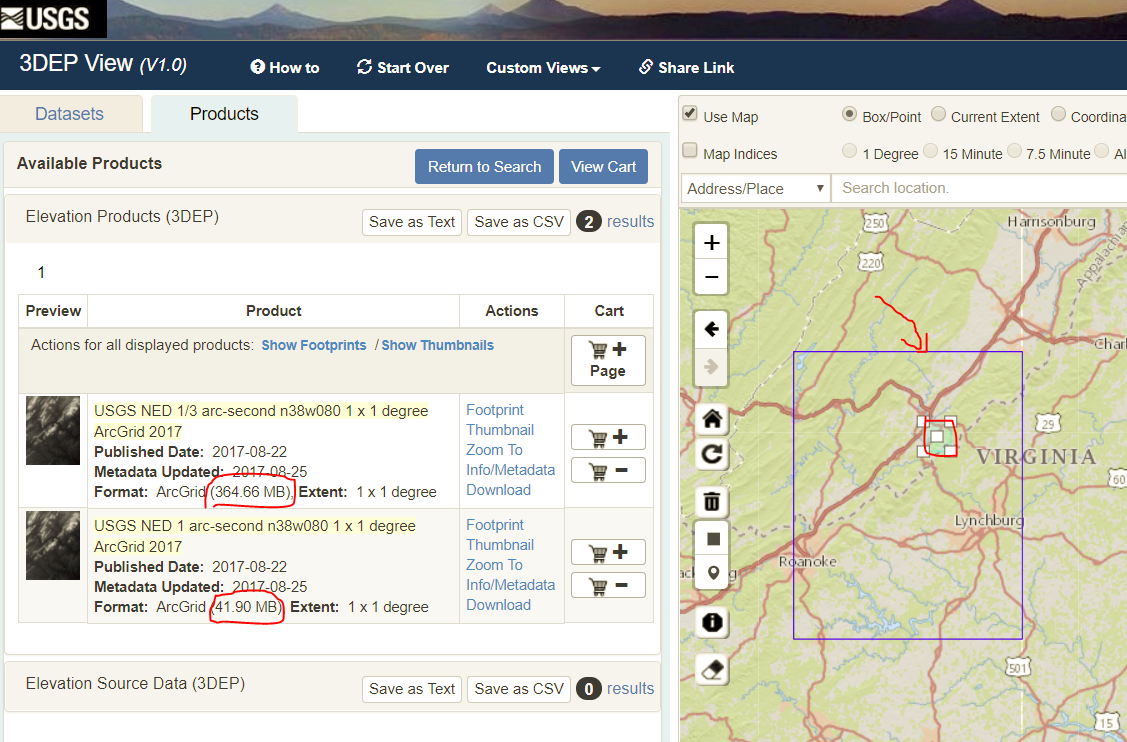
- The second map tab “National Map downloads” shows the difference between grid resolution data for the same 1×1 degree square.
- The third map tab “Data Types” shows many different DTM versions.
- We will examine grid, TIN, and contour datasets.
- Compare these data to what’s available online
- select the “add data button” and from the “living atlas” select “Terrain.” (not “Terrain: something else”)
- increase the transparency of the layer
- “add data” and choose “Terrain: multidirectional hillshade” from the Living Atlas, make sure it is below the DEM
- Group these two layers like the existing DEM
- Fourth map tab is for later…. visibility analysis.