Band Correlation
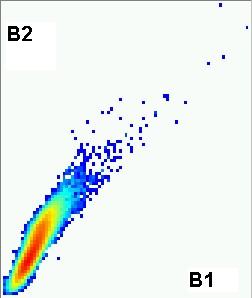
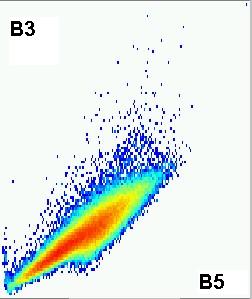
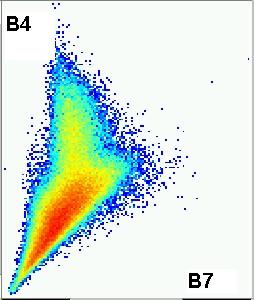
In most images the radiation that you receive in one wavelength is strongly correlated to the radiation amount in most other bands. Bright is bright across the spectrum, as is dark. We see color or spectral differentiation in IR when radiation varies from the correlation line.
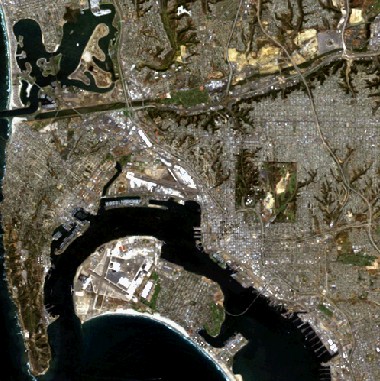
Here are some band correlations for a Landsat 7 Virginia scene. This shows how, for each pixel, the radiance in one band compares to the radiance in others. I do not think we can see these kinds of plots in ArcGIS Pro!
Band correlation produces images without much contrast. To eliminate the “paisley” colored images, we remove the correlation in Hue-Saturation-Intensity (Value) space. Shift the image from RGB to HSI (HSV in ArcGIS speak) and then change the Saturation, and put it back to RGB. In ArcGIS Pro, these are Raster Function operations.
 goes to HSV
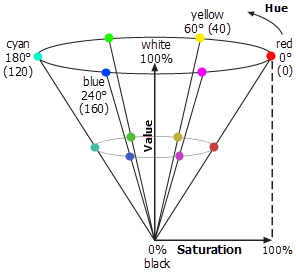
from ArcGIS Pro Help file
Here is a RGB_321 (left) and RGB to HSI transformation with the color Saturation stretched to enhance color. (but in a different program…..)