Proximity
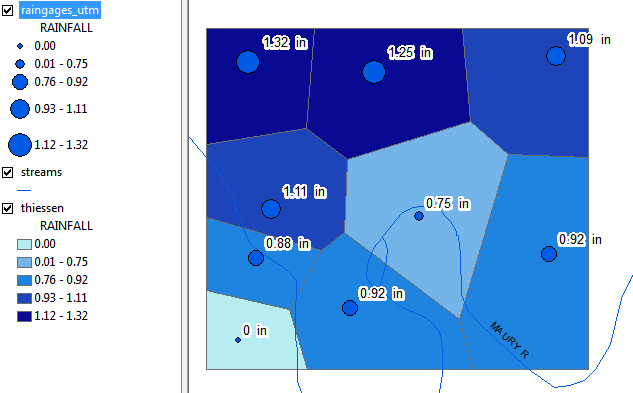
During a rain storm, we collect rain data only at isolated points. But what rainfall do we assign to the area between the gauges? In hydrology, one makes “Thiessen” polygons, that associate every point or area on a surface with the nearest gauge. Search that name in the toolbox. In GIS, this is also known as “proximity to a feature” or “allocation.” For rasters, this is the “allocation” function under the “distance” toolset in spatial analyst (see Euclidean Allocation in the ArcGIS Pro help)). The map shows rain gauges; open the table to see the rainfall at each gauge. By summing the area (how do we get that?) times the rainfall, we can get total rainfall, or average, based on areal coverage.
see …sharedwork\Demo\proximity\proximity project
Let’s try this on streams too.
Though Experiment
- If you are trying to determine areas that will flood (< 20 ft above the river), how will Proximity help you?
- Can you determine the steps given data for streams (vector) and elevation (raster)?
Other measures of “nearness”
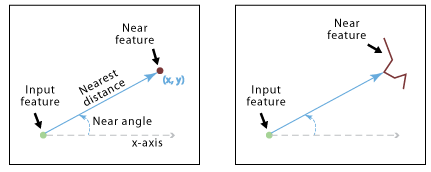
- What is the closest feature (or features, or points) to another feature or point (output by new feature or new table). Use the Near tool from the Proximity toolset
—- in the proximity project, can you find the closest stream to each rain gauge? - What polygons are touching the sides (and nodes) of source polygons?
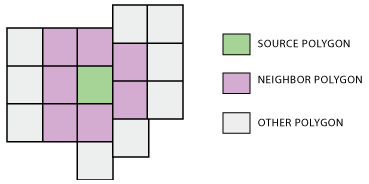
Here’s the Polygon Neighbors Tool that “creates a table with statistics based on polygon contiguity (overlaps, coincident edges, or nodes).” ArcGIS Pro help