The shape of lines
We have many reasons to look at the shape of linear features in a GIS. Can you think of a few?
Two from my field (geomorphology) are stream channel sinuosity
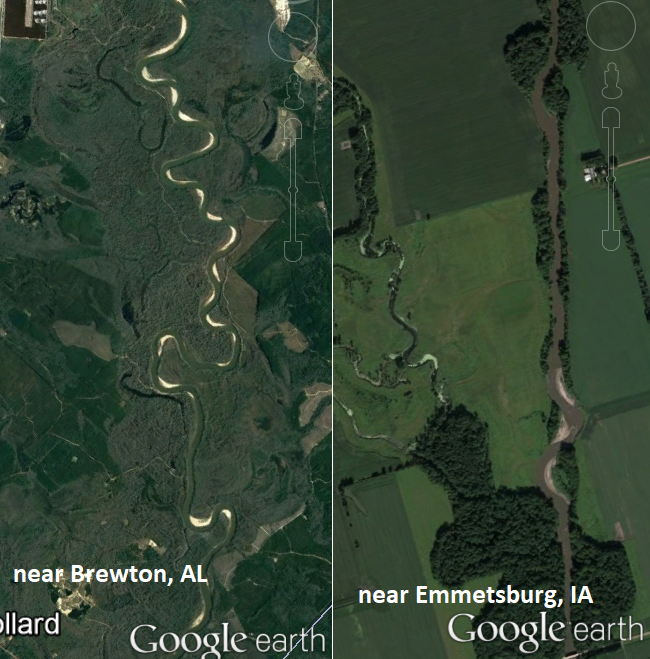
and mountain front sinuosity,
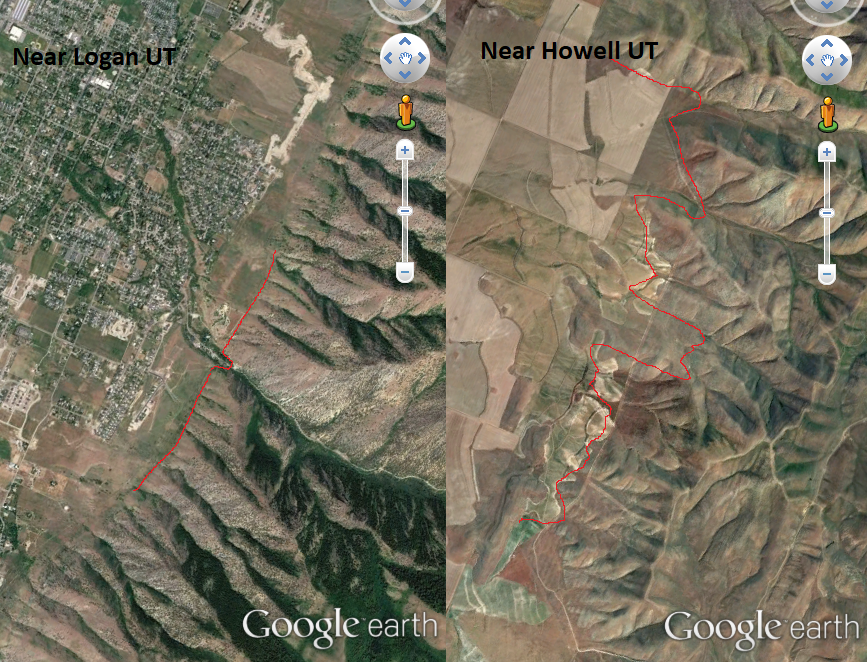
each of which tells informs the processes active in the landscape.
Some other characteristics I can think of are:
- length (How would you do it for a polyline? From beginning point to end point, or following the polyline?)
- azimuth or orientation
here is an example from the “Linear Directional Mean” tool, which would average the stream directions as shown
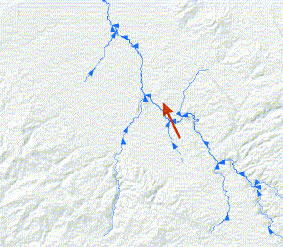
(Geographic Distributions tools) - sinuosity
- thickness (for grid “lines”)
- max (or min) lat /long or x/y
- centroid
Calculating Sinuosity
Open demo\shape\shape project.
Scripts to determine many of these might be available in ArcGIS Pro through the “user communities.” This particular example (CalculateSinuosity.pyt) is from the ArcGIS Pro Help. I saved this script file to the project folder; you can open and run it from there.
Let’s open it with notepad or the above link first to examine how it works.
- Lot’s of setup to make it a proper tool with input parameters (the layer you want to analyze and the output attribute).
- Creates a new field to hold the answer.
- Calculating the value is at the very end after “import math” which brings in the math tools for ArcPy
- defines a function “getSinuosity(shape)”
- reads parts of the shape or polyline “class” in order to calculate the line lengths “length = shape.length” (“length” is their new variable)
Note that many attributes of a vector feature are available to you through arcpy classes (e.g., shape.length or shape.firstPoint.X, see here for more polyline shape attributes) - defines the sinuosity as the “answer” that the function returns “return d/length”
- finally it runs the function on the shapes “arcpy.CalculateField_management”
- all good?
Measuring orientation
In the “orientation” map, examine the difference in orientation between the piedmont and valley & ridge streams.
- Use the Geographic Distribution “Linear Directional Mean” tool and examine its output. Is one measure (average?) enough? What other tool in the Spatial Statistics toolbox would work for differentiating the geometry of the stream network in these networks?
- Use “Add Geometry Attributes” (not Calculate Geometry Attributes” which requires you to already have a field for the answer) tool to insert a “line direction” attribute, and chart it (histogram).
Are the stream orientations of the two areas different?