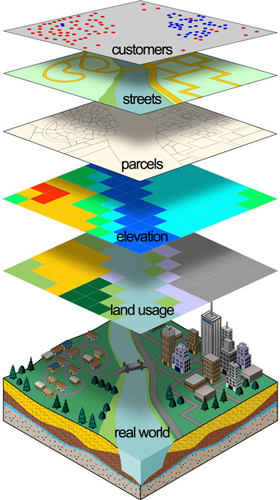
Overlay Analysis is the process of combining data or information from multiple datasets to arrive at new information.
from GIS Wiki at gis.com http://wiki.gis.com/wiki/index.php/Overlay
Overlay analysis can be accomplished with any data type (raster, vector, etc) but the type of output results depend on the type of input. A spatial join might allow you to count all the burglaries (a point file) within the precincts. Or show the average time of the burglaries (if that is one of the attributes).
Some types of overlay analysis are
- spatial joins ( a form of inverse modeling)
where the attributes of one layer are analyzed (mean, range, max, etc) based on whether they occur within/near/outside of units of another data layer. - map algebra
- Boolean combinations
(Hay fields AND gentle slope)
(<1000 ft from a stream NOT forested) - simple math on two or more layers (e.g., Crime events in one year plus crime events in another.)
- Boolean combinations
- tabulate areas or cross tabulation (like a spatial join)
- What fraction or area of one layer (e.g., slope) characterizes the different values of another layer (e.g., geology)
- editing or combining layers the contain the shapes, extents, and/or attribute information of input layers
- clipping
- intersection
- union
- etc
- More ideas here http://wiki.gis.com/wiki/index.php/Overlay