Simplification facilitates overlay
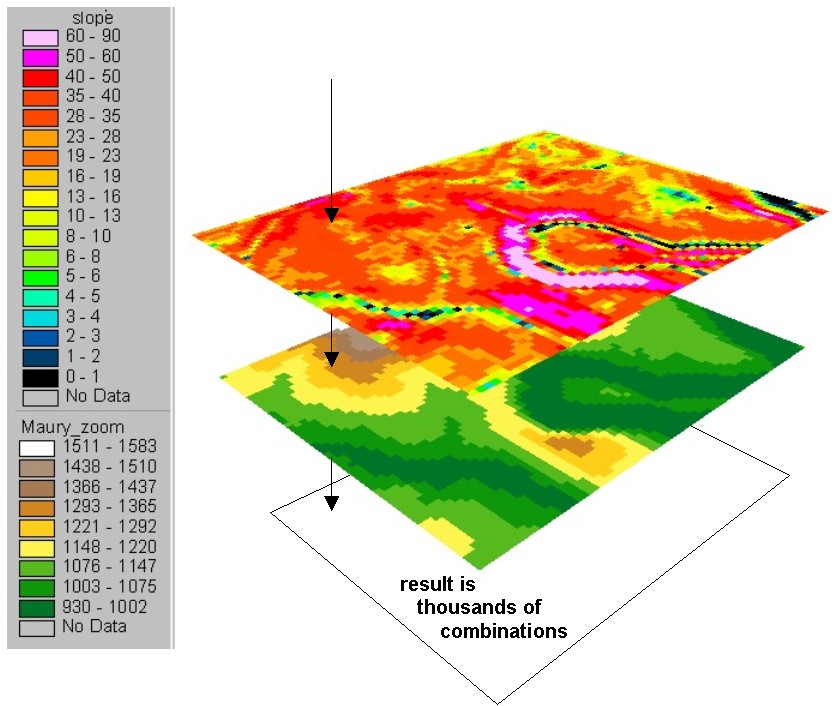
One of the things us old folks used to do with paper maps was trace the data onto mylar or tracing paper, and put it over another map. This analytical fiesta allowed the comparison of more than one variable. However, using complex or continuous variables in an overlay leads to very complex output (and smudgy mylar maps). For example, try looking for a certain combination of slope and elevation by combining two continuous variables. The result is thousands to millions of possible combinations.
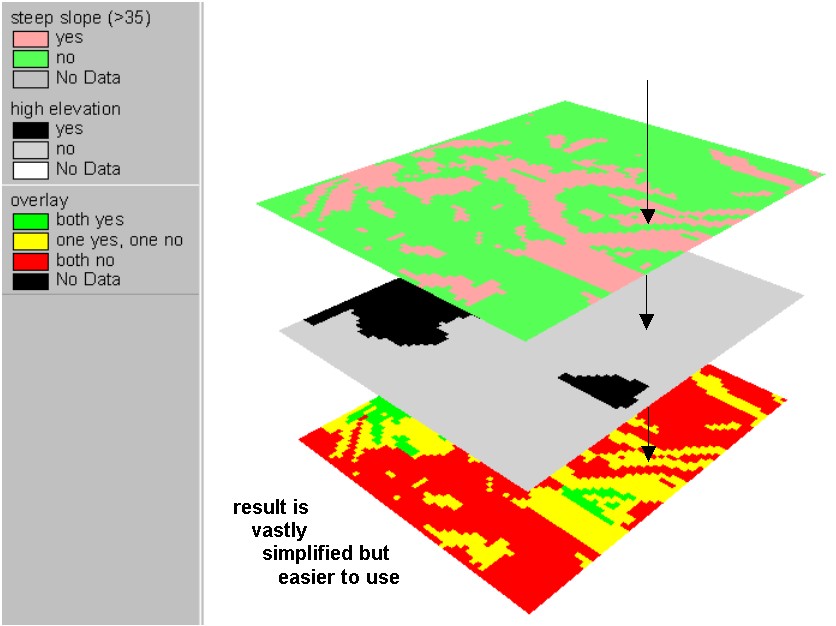
But simplification first leads to fewer resulting combinations (here this is a “binary” simplification).
Here’s an example from http://www.fao.org/
They simplified to 3 levels in each overlay map. The overlay process usually begins with simplification of the data, which we explore next.