Project 1
Environmental Justice: mapping the distribution of toxic releases in poor and minority neighborhoods
Your goal in finishing the task below is to use the skills that you have developed completing the exercises and in class, as well as to add some curiosity about what you could, or might be able to do…..and do it. You are encouraged work with one other person (who you may not work with on another project until the final project), but be mindful that you need to keep developing your own skills and should be able to complete all the processes by yourself by the end of the project. But DO learn from each other. Please do you own work as an individual or pair; don’t share your process with other groups or use another group’s work in some way.
- The Data
- you will find and ingest data for 2022 and for Virginia only
- Census (at the tract level)
- Tract geometry as “Tiger/line” shapefiles
- Tables of population by poverty/race/ethnicity for Virginia Census tracts
- EPA Toxic Release Inventory
- tables of releases by chemical and company for all of Virginia, also for 2022
- The Tasks
- upload and ingest the data into a single, well-organized ArcGIS Pro project folder, that can have subfolders of data
- map the population distribution based on poverty and/or ethnicity and on the toxic releases for a portion of the Virginia tidewater region
- analyze and map the relationship of poor and/or BIPOC populations and releases either
- simply – just display both types of data together in one map, by visualizing them in a way that your viewer can make the analysis you want to display.
- map one or more geospatial analyses of the distribution of total releases in relation to the distribution of poor and/or BIPOC populations (they will entail going beyond what you’ve learned to do in class)
- produce a layout that shows the results of your analysis or visualization and include other elements that will allow a viewer to understand it.
- create metadata for your data and map layers
- create a brief explanation of your GIS process
- upload your material to Canvas (discussion or assignment TBD)
Getting the data
- You may search the web other of sources of these data that I’m not covering here; but you have to make sure you know what you’re getting and you need to save the steps that got you there (the google search, the map server, which layers you got, etc) so I and others could potentially follow your steps.
- Downloading Census table data (csv tables that contain poverty/race/ethnicity information from the American Community Survey)
- start here https://data.census.gov/
- In the search bar type “2022 Virginia Poverty” and go.
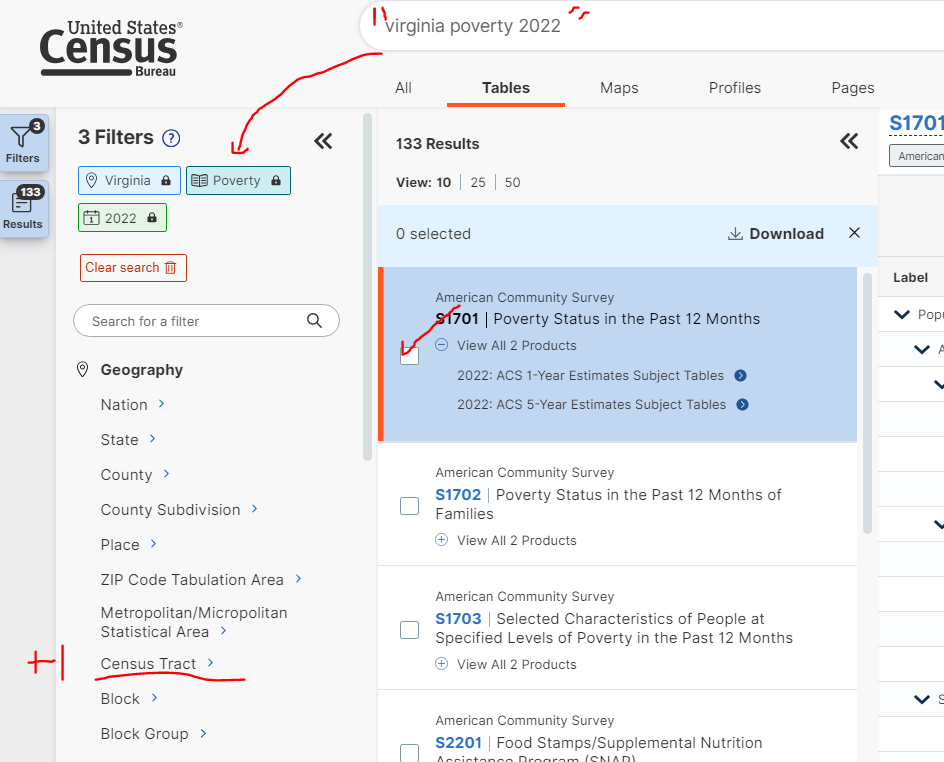
- These search terms will become filters for the huge number of data tables (select the table tab) available at the census. The values shown at the right in your window, however, are for all of Virginia, not each census tract. We need a table that divides the poverty numbers into finer divisions.
- To add this 4th filter, under “Geography” Choose Census Tract, then Virginia, then All Census Tracts within Virginia and the restriction should appear in addition to the other three in your filters.
- Select the S1701 table (the result window on the right should say the table is too big to display). You want the 5-year estimate, because that is valid for all areas, not just larger population areas. More information on the estimates here.
- Click the download button above the table list or in the window. Make sure it gets into your downloads folder, not the project folder. When you unzip it you’ll have three files
- the data table (.csv)
- a list of the columns (with the word “metadata” in the filename
- and a text file with more metadata
- In the search bar type “2022 Virginia Poverty” and go.
- Ingesting the Census data
- Read the column metadata, which highlights which columns you need to determine poverty or BIPOC vs white population. How you define it is important, and should also be part of your metadata.
- Make your csv table readable by ArcGIS Pro as follows,
- only one header row (not the two or three that the census table gives you.
- field names should not start with numbers.
- all rows in a single column except the top header row should be the same (text or numbers). Mixed columns will be assigned text
- You can turn all the columns off in the fields view once they’re in ArcGIS (recommended, in case it turns out you DO need them)
or
You can delete those that you don’t need in excel before you upload it. - Do all your calculations in ArcGIS Pro (not excel, except getting the headers correct on the fields)
- import as csv or excel and save the table with a good name into your geodatabase
- Download the Census Tracts polygons
- Search the web for “census tiger/line shapefiles” to download .
- Find the 2022 version.
- download Virginia census tracts (as a zip file I believe) into your “downloads” folder, use 7zip to unzip them in that folder, and ingest them into your project_1 geodatabase as a feature class.
- This file has the geometry that you join your demographic table to.
- Download the EPA’s Toxic Release Database (2022)
- Go here https://www.epa.gov/toxics-release-inventory-tri-program/
- Click the Use and Access Data section (rightmost of the three pictures)
- Start with the “Select the best tool for getting what you want” (You are not going to use a “tool,” you’re looking for data)
- find the “TRI Data and Tools for Advanced/Customized Analysis” section of the that page. Hit Go!
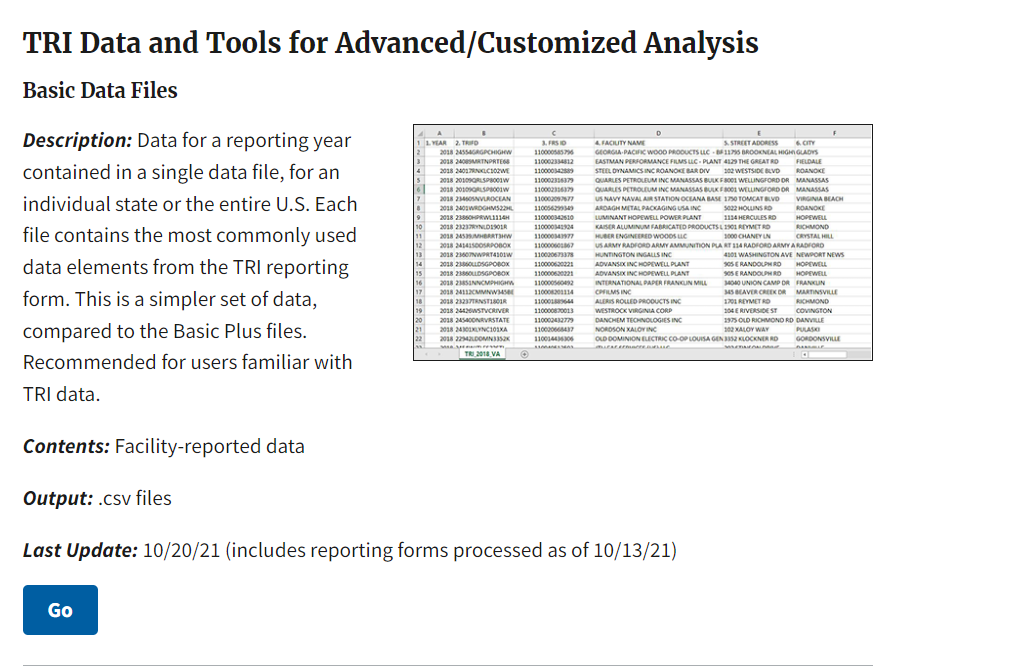
- Select 2022 (and only in VA!)
- download the csv file for Virginia for 2022 to your downloads folder and unzip it there.
- NOTE the links to files lower on that download page that tell you what’s actually in that TRI table 🙂
- start here https://data.census.gov/
Notes on data processing
-
-
- Before doing any display, analysis and processing, select only those Census Tracts that are completely within the study area (clipping might distort the area calculations some may choose to complete). The Tidewater “study area” shapefile can be found in the box.
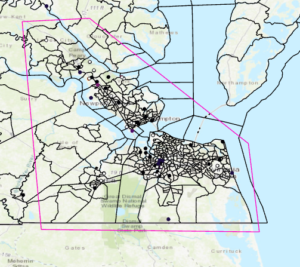
- The spatial reference for the TRI point longitude/latitude data is in one of the columns adjacent to the coordinates. You can add these “XY data” as a temporary layer and then select points inside the clipped tracts polygons and save it to your geodatabase as a feature class.
- The data you “need” for TOTAL releases (both air and water) are in this column
“ON-SITE RELEASE TOTAL” (maybe column 62?)
or
the Total onsite and Offsite (shipped somewhere else) “TOTAL RELEASES” (maybe 104 or 105?)
and you may want to look at these metadata https://www.epa.gov/toxics-release-inventory-tri-program/tri-basic-data-files-guide to find out what these numbers mean. - It might be a good ideas to use the “Fields View” to turn off (hide from visibility) most of the other fields
- NOTE! There may be multiple rows for each company/release point (and hence, coordinate pair), so you’ll have to think about how to deal with the overlap (remember your corn harvest techniques?). Each row is a different substance I think. What are the units?
- save or copy tables to your geodatabase before you edit them (they are read only as csv files)
- The Census table does not have the same GEOID as the Tiger/line file :/
for an example tract
-the Census table: 1400000US51001090100
-the Tiger Tract polygon: 51001090100
Once you’re in ArcGIS, use “add field” and calculate field” to get just the right-most 11 characters of the Census table (note it is a text string) to use as a “key” field for joining the two tables. Remember to keep a notes file (“breadcrumbs”) on how you figured out how to do that! You’ll forget and may need that again. Should it be in your metadata? - Think about the map projection for your layout. What should it be?
- Before doing any display, analysis and processing, select only those Census Tracts that are completely within the study area (clipping might distort the area calculations some may choose to complete). The Tidewater “study area” shapefile can be found in the box.
-
The deliverables
- Please post an exported PNG image of your layout to the Canvas Discussion as a large image so we can see it there (you won’t be able to see other posts until you finish posting yours). Each person in the team should post the map and short description of it.
- Below it describe in a few short sentences what you’re trying to show in the layout and what you see in the results (some of what you see :).
- Then post a pdf of your layout, plus a word doc (or pdf) with the following information to the Canvas Assignment
- who completed the project
- where the project folder is located (box or geodata)
- a list of data layers (by their feature or grid name as stored in the project geodatabase) that contain the information and metadata actually used for the project (not ALL of them, but the ones that got you where you wanted to go)
- a snip of the catalog view of your geodatabase
- snips of the map and data metadata you created
- a very brief bulleted list of the steps taken (here use only a few words, put the detail, if necessary, in the metadata)
- I will evaluate your process and results plus the utility and presentation of your final map(s). I will also look at your project folder and assess the geoprocessing history and metadata on files that are downloaded and/or changed during the project. It should be clear to me from the “Item Description” part of the metadata (the one part it makes sense for you to edit) plus the Geoprocessing history what you did to make all magic happen.
The rubric (75 points total)
| Pts | Excellent | Good | Fair | Poor | |
| geoprocessing – steps taken and attempt to determine relationship | 5 | 5 – clear path to correct and complex analysis of spatial relationship and it is clearly listed in the report | 4 – got the right data; tried a spatial analyses that show both data layers together (good visualization) | 3 – incorrect or convoluted steps that cloud actual process, and/or not listed completely in step; simple visualization | <3 – untraceable or incomprehensible path of analysis or upload and no analysis beyond display of both properties |
| geoprocessing -getting the right data, and your folder/data architecture | 20 | 20 – All data analyzed to yield correct values for population and toxic releases; relationship explore through further analyses; all data in proper place and well-named | 16-19 – Most data correct, but a processing error yields partially incorrect values; some analysis attempted; data/folder logical but messy or / disordered | 12-15 – processing errors distort the relationship between race and toxic releases; folders chaotic or disordered; names hard to follow | <12 – presented values have no similarity to actual releases or population; can’t find/access your data files |
| layout presentation general | 10 | 10 –the presentation uses the space wisely and fully, making all elements easy to read and interpret | 8-9 –presentation would benefit from better arrangement, size or kind of layout elements | 6-7 –poorly organized for presentation of data or use of space | <6 – maps, titles and portions of necessary elements dropped into a layout with no thought to utility |
| map elements (legends, north arrow, scale etc) | 10 | 10 – has all the elements and considers extra details that aid understanding; spatial character of map(s) correct. | 8-9 – has most elements requested; map spatial nature is skewed | 6-7 – is missing key elements, which clouds information; spatial presentation incorrect | <6 – lacks necessary items to interpret spatial context and data |
| presentation of map data (symbology, tables and/or labels, etc) | 15 | 15 – results can be easily understood from the map(s) | 12-14 – map(s) are clear but some information is complex or less easy to interpret | 9-11 – data are presented but in a fashion that is difficult for the reader to understand or see | <9 – data are not presented, or are so done in such a way that readers can’t understand |
| metadata | 15 | 15 – all necessary data and maps have clear and brief metadata edited in the catalog view or layer properties as appropriate | 12-14 – most or all data and maps have metadata but some is unclear or unnecessarily verbose, or misplaced | 9-11 – insufficient or missing metadata, or it is not recorded correctly | <9 – most data files and layers lack metadata |